ASC Partner Scientist
Up until this point, all the microplastic I’ve counted has come from surface samples. But, my most recent batch of samples included water from ASC adventurers in Palau, who took our first scuba samples, as well as a well-prepared Alaskan adventurer who used specialized equipment for sampling water from the deep ocean.
|
It was exciting to handle subsurface water, but finding very high amounts of plastic in the samples felt like a blow, and unfortunately, the results speak loudly on the state of the marine environment.
The results from the samples taken at depth are very intriguing—both sample sets contained higher amounts of plastic than their surface counterparts. We have been seeing a very high concentration of plastic at the surface level, much higher than many studies due to the sampling technique and filter size employed by this study. Contributions to this project help us understand the concentration and distribution of microplastics in the world’s oceans. Gathering more sub-surface samples in the future will help to determine if plastic pollution is prevalent throughout the water column or if the samples from Palau and Alaska are anomalies. |
Sample Analysis
After receiving a one-liter bottle of ocean water, ASC partner scientist Abby Barrows vacuum pumps the samples over a gridded .45-micron filter. After the sample has dried for 24 hours, she uses a microscope at 40x magnification to look for pieces of plastic smaller than 5 mm in size. Moving systematically along the grid lines, Abby categorizes each piece of plastic based on shape and color. Some of the averages in these summaries may seem low; this is because many samples are not exactly one liter, so Barrows divides the total number of plastics by the water quantity. |
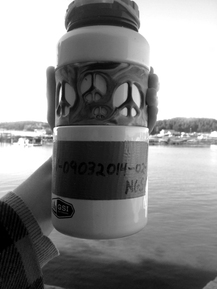
 Abby holding Enric Sala’s microplastics sample
Sampling platform: Launch boat
Barry Jackson collected one liter of water, 18 pieces of plastic were counted in total with an average of 14 pieces per liter. All plastic was categorized as filamentous with blue being the most common color.
Cape Wrangell-Alaska
Sampling platform: Boat
This is the second round of samples that John Whittier has collected for the project. He collected eight liters of water, 136 pieces were counted in total with an average of 17 pieces per liter. John collected five samples at the surface and three samples at 93, 105 and 173 meters depth. These are the first samples collected using a Niskin bottle for this project. Interestingly, the samples collected at depth had a higher number of plastics (81 pieces compared to 60 at the surface). The depth samples averaged 27 pieces per liter with the surface samples averaging 10 pieces per liter. Blue and transparent filaments were the most common colors and shape at both surface and depth.
French Coast-Bay of Biscay & the Mediterranean
Sampling platform: Sea Kayak
Theo LeBouc collected four samples from the coast of France. One sample, from an inner bay on the Mediterranean coast contained no plastic, but it did include a few small snail shells. In total 10 pieces of plastic were counted with an average of 2 pieces per liter. Five of the pieces were transparent/white and four were blue. All but one piece (‘other shape’) of plastic was categorized as filamentous.
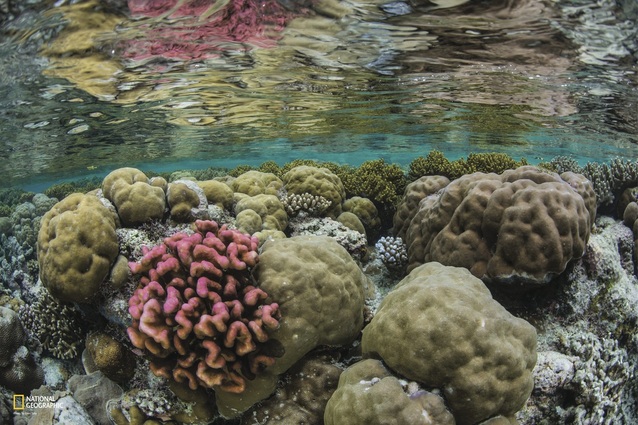
Palau-National Geographic Society
Sampling platform: Boat & Scuba
Alan Friedlander and Enric Sala collected 22 water samples as part of the Pristine Seas expedition. Every sample collected contained plastic, with a total of 454 pieces counted and an average of 16 pieces per liter. This expedition was the first ever to take water samples for the Microplastics Project using scuba. They took 12 samples at the surface and 10 at depth. Interestingly, even though there were two fewer samples taken, the samples at depth contained a higher total number of microplastics- 258 pieces compared to 196 from the surface samples. The average number of pieces per liter was 19 at depth and 12 at the surface. Filamentous plastic (445 pieces) was the predominate shape counted in the 22 samples. Transparent/white was the common color counted for both surface and depth samples. The second most common was black in the depth samples and ‘other color’ in the surface samples.

