By: Emma Bode
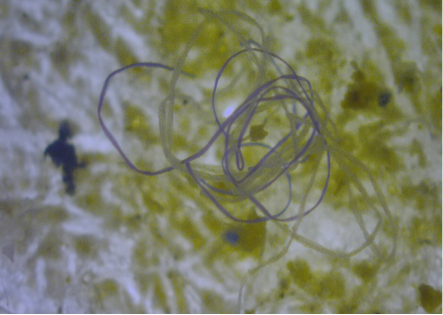
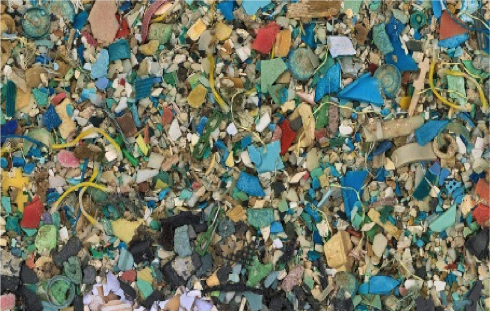
Each year, 8,000,000 tons of plastic enter marine environments*. An astonishing 80% of this plastic comes from terrestrial sources. Among this plastic are tiny plastic fragments and fibers, five millimeters or smaller, known as microplastics. How are these minuscule pollutants entering our waterways?
At the headwaters of the Missouri River, the Gallatin Watershed provides a great opportunity to observe the effects of urbanization on freshwater microplastic levels. Through the Adventure Scientists’ Gallatin Microplastics Initiative, volunteers like myself collect water samples from a multitude of sites across the watershed. These samples are then analyzed for their microplastic content.
|
As a class project in Applied Geospatial Information Systems (GIS) & Spatial Analysis at Montana State University, I explored spatial relationships in the Gallatin Microplastics Initiative dataset.
|
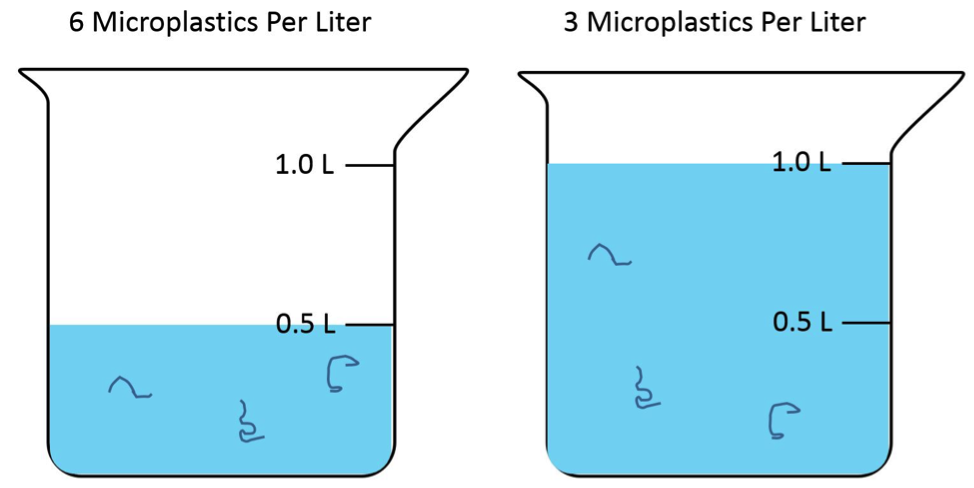
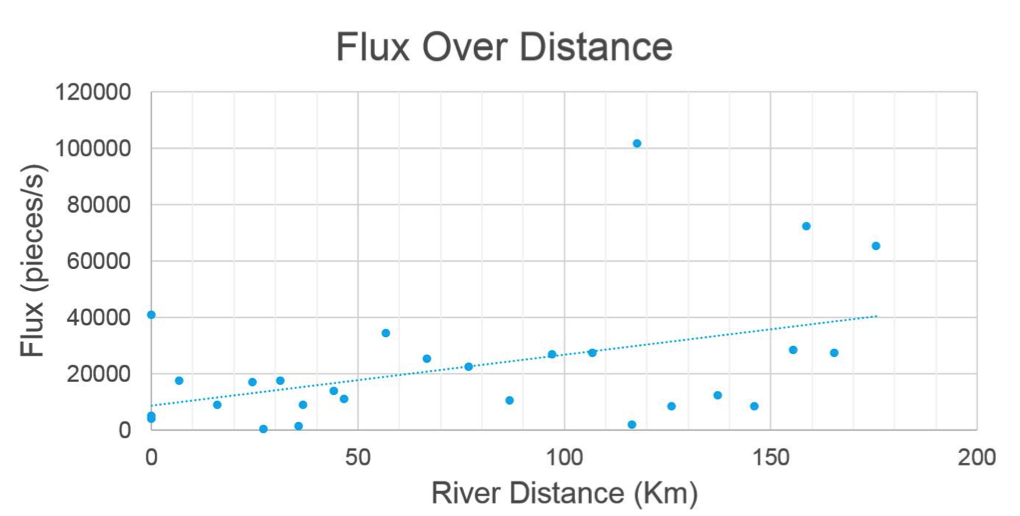
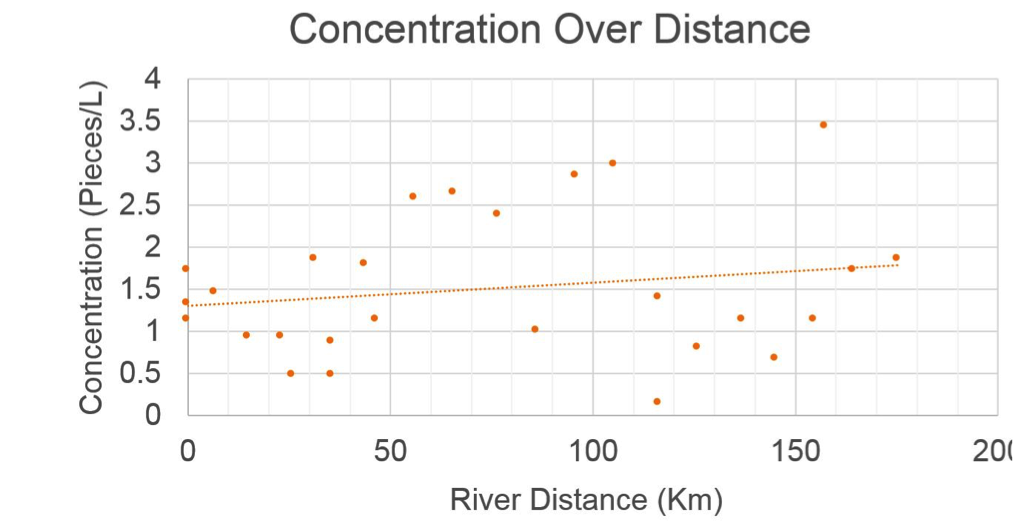
This dataset measures microplastics levels in terms of concentration (i.e. number of microplastic pieces per liter). Since the volume of the river increases downstream, I took into account the flux of microplastics (i.e. the number of microplastic pieces per second) in my study as I theorized it may reveal a stronger trend in pollution levels.
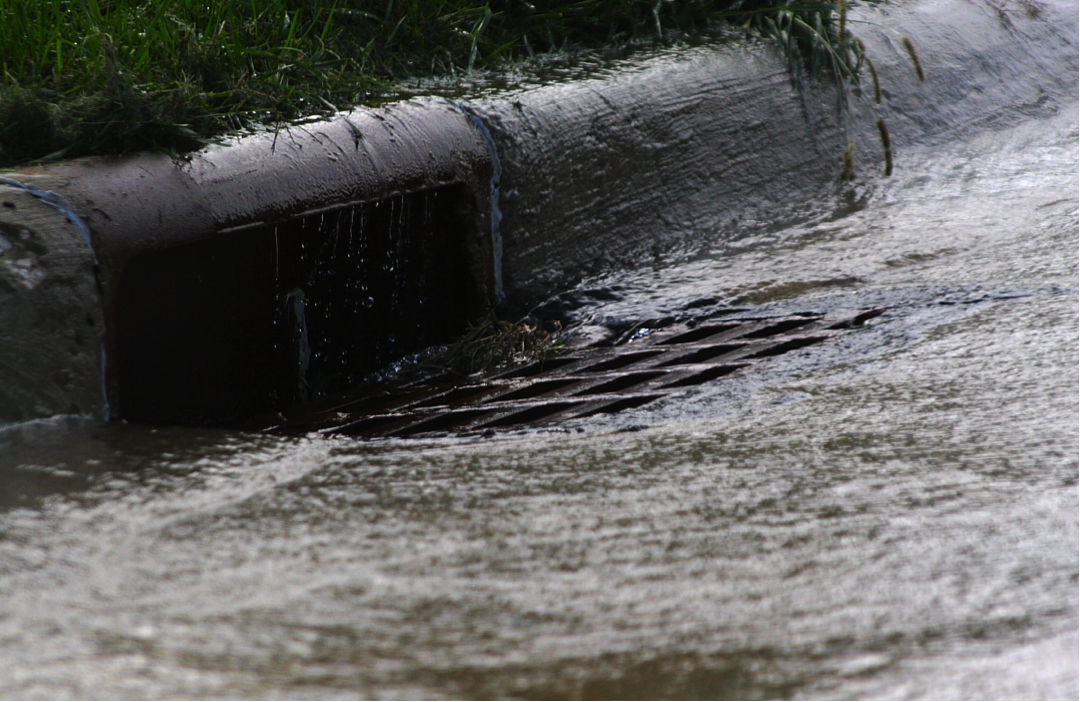
When rain falls on an impervious surface, such as pavement or concrete, it cannot be absorbed and instead runs off into drainage systems and waterways. Could impervious surfaces be carrying microplastics from urban areas into our streams and rivers?
I hypothesized:
I hypothesized:
- The trend in microplastic pollution levels will be more apparent if measured in flux rather than concentration, because flux controls for a changing river volume.
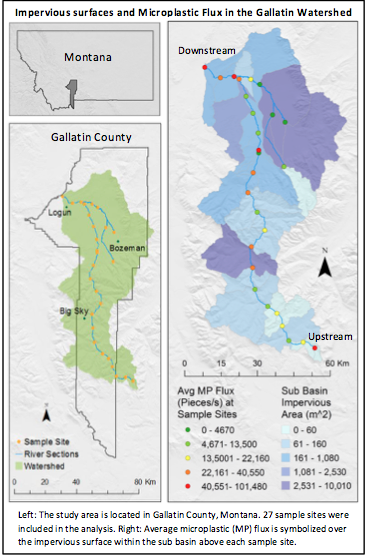
- If microplastics are carried into waterways by urban runoff, then there should be an increased amount of pollution with increased impervious surfaces downstream.
Methods:
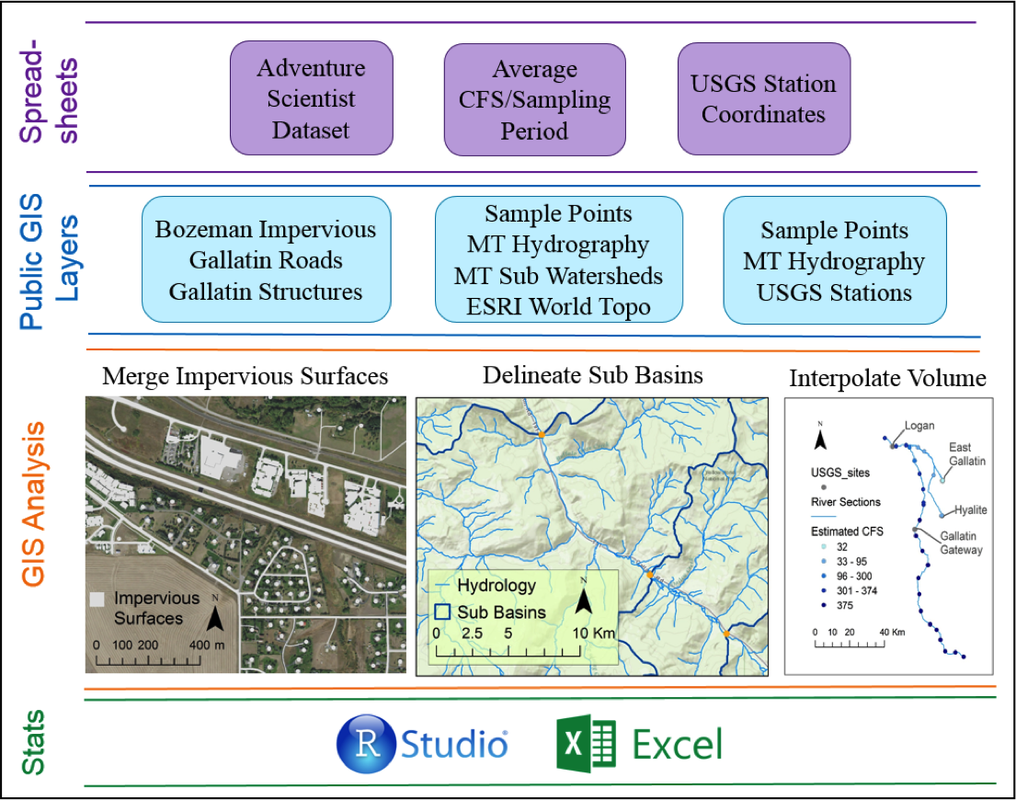
I used three spreadsheets to test my hypotheses: the Adventure Scientists data, river volume during sampling times acquired from United States Geological Survey monitoring stations, and several publicly available GIS layers. With this data, I performed a GIS analysis of the impervious surfaces, land area draining to each sample point (referred to on the map below as a sub basin), and the river volume between known monitoring sites. Then I analyzed the statistical relationship between impervious surfaces and microplastics pollution.
Results:
Converting concentration to flux improved the strength of the relationship between river distance (from our first to last sample point) and microplastic pollution. Impervious surface is not as strong an indicator of pollution levels as just the river distance, but does convey some amount of correlation. Perhaps a more precise measure of impervious surface could reveal a stronger relationship.
Why are there high microplastic levels in our most upstream sample site? How does microplastic pollution decrease after a higher level measured upstream? Are environmental systems absorbing the pollution? Could other human factors such as waste water treatment plants, sewage holding tanks, or tourism be introducing microplastic into the waterways? Only further study will reveal the answers to these pressing questions.
Why are there high microplastic levels in our most upstream sample site? How does microplastic pollution decrease after a higher level measured upstream? Are environmental systems absorbing the pollution? Could other human factors such as waste water treatment plants, sewage holding tanks, or tourism be introducing microplastic into the waterways? Only further study will reveal the answers to these pressing questions.
This research was completed by Emma Bode using the Gallatin Microplastics Initiative dataset. All conclusions have been drawn by Emma and do not necessarily represent the views of Adventure Scientists.
Join our online network of people around the world working together to unlock solutions to pressing environmental issues.

